df <- data.frame(
    x = 1:4,
    y = c("a", "b", "c", "d"),
    z = c(TRUE, FALSE, FALSE, TRUE)
)
df
x y z
1 1 a TRUE
2 2 b FALSE
3 3 c FALSE
4 4 d TRUEPOP88162 Introduction to Quantitative Research Methods
Let’s turn to working with data frames. Here is an example data frame that we looked at in the workshop.
df <- data.frame(
x = 1:4,
y = c("a", "b", "c", "d"),
z = c(TRUE, FALSE, FALSE, TRUE)
)
df x y z
1 1 a TRUE
2 2 b FALSE
3 3 c FALSE
4 4 d TRUEStart by applying the usual functions for understanding the structure of the data.
str(df)'data.frame': 4 obs. of 3 variables:
$ x: int 1 2 3 4
$ y: chr "a" "b" "c" "d"
$ z: logi TRUE FALSE FALSE TRUEdim(df)[1] 4 3summary(df) x y z
Min. :1.00 Length:4 Mode :logical
1st Qu.:1.75 Class :character FALSE:2
Median :2.50 Mode :character TRUE :2
Mean :2.50
3rd Qu.:3.25
Max. :4.00 We can subset columns by names of by their positions in the dataset. Say, column y is the second column in the dataset df. Thus, we can subset it with two different ways:
df$y[1] "a" "b" "c" "d"df[2,] # Notice the similarity to matrix subsetting above x y z
2 2 b FALSER allows not only subsetting by known indices, but also provides tools for dynamically calculating which values we want to be subset. Here we are subsetting all rows, where values in the column x are larger or equal to 2:
df[df$x >= 2,] x y z
2 2 b FALSE
3 3 c FALSE
4 4 d TRUEWe could, of course, write df[2:4,], but this approach is considerably less flexible and requires our prior knowledge about the indices. The crucial part of the subsetting above is the logical vector produced by the inner expression:
df$x >= 2[1] FALSE TRUE TRUE TRUEAny valid R expression that produces a logical vector like this could be used to subset rows. Here is another example with a column, which contains character values:
df[df$y == "c",] x y z
3 3 c FALSEIf we want to subset rows based on values in a character vector where more than one value satisfies our criteria, %in% operator can be very helpful:
df[df$y %in% c("c", "d"),] x y z
3 3 c FALSE
4 4 d TRUENow practice subsetting with a full democracy-v4.0.csv dataset. Download the file from Blackboard. Read it in as before with democracy_2020.csv. Change the file path below to the file path on your computer.
democracy <- read.csv("../data/democracy-v4.0.csv")Try selecting all rows corresponding to Ireland in the data. Now repeat the same for Portugal. Note that country names are capitalised in the data. Calculate the proportion of years when Portugal was classified as democracy.
The principle function for creating plots in base R is plot(). By default running plot(x_var, y_var) will give you a scatter plot:
points <- data.frame(
  x = rnorm(100),
  y = rnorm(100),
  z = rbinom(100, 2, 0.5) + 1
)plot(points$x, points$y)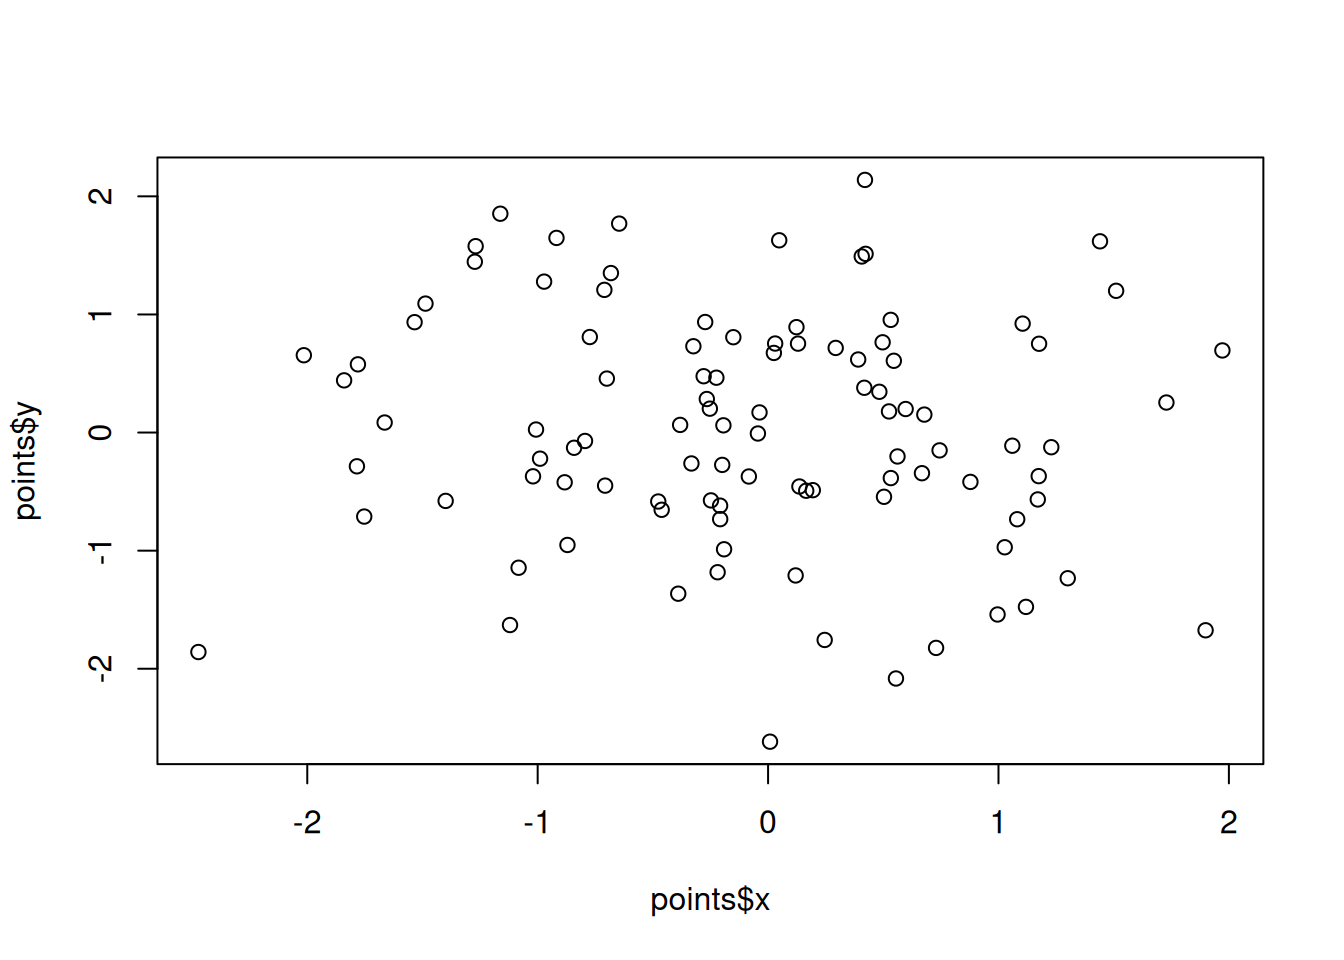
We can colour individual observations in scatter plot by another variable:
plot(points$x, points$y, col = points$z)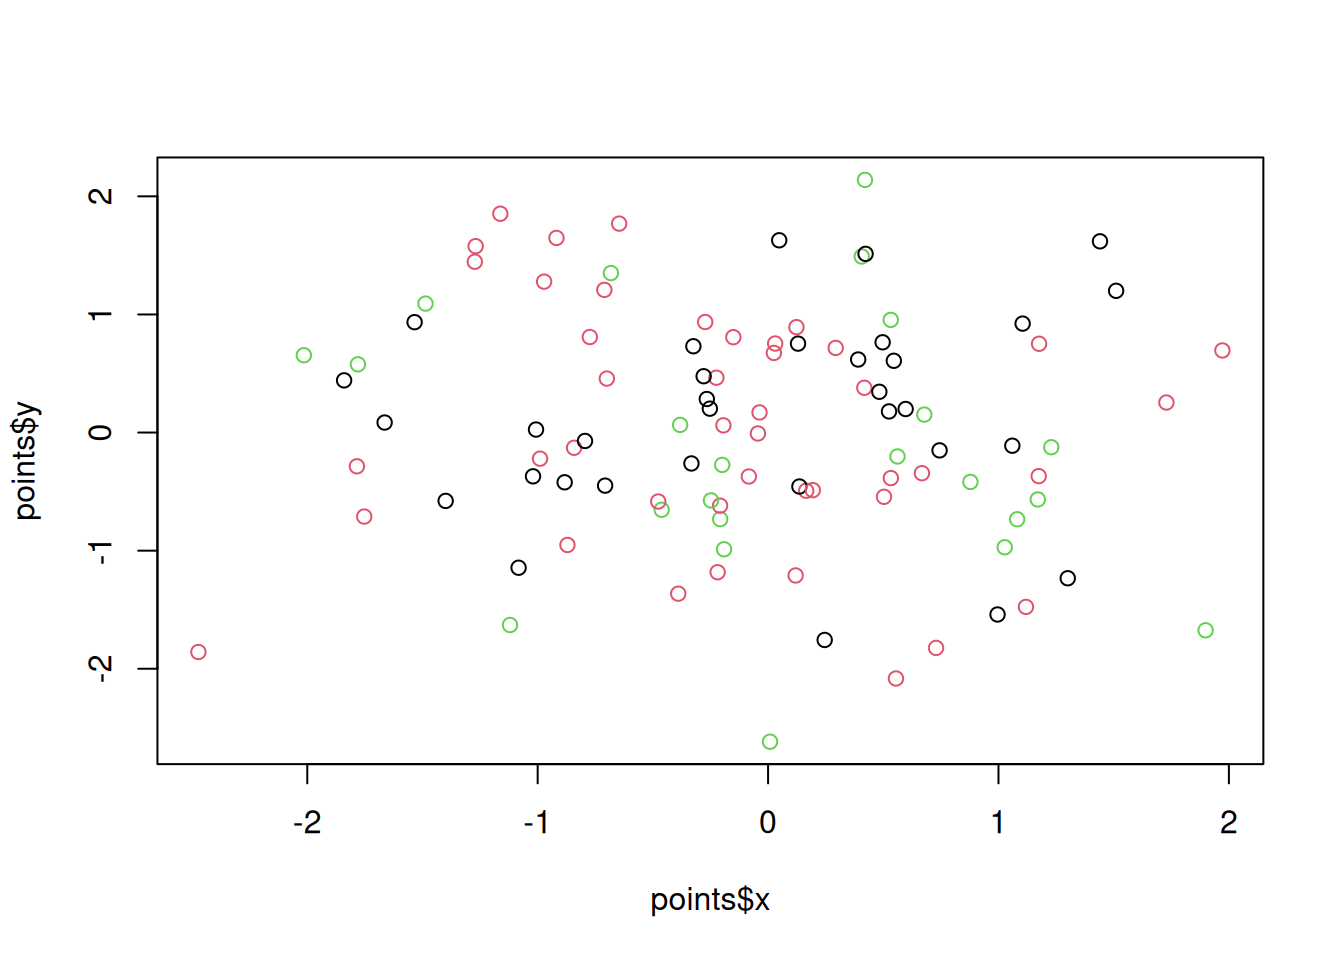
We can further adjust the type of points. Check ?plot for a full list of parameters.
plot(points$x, points$y, pch = 19, col = points$z)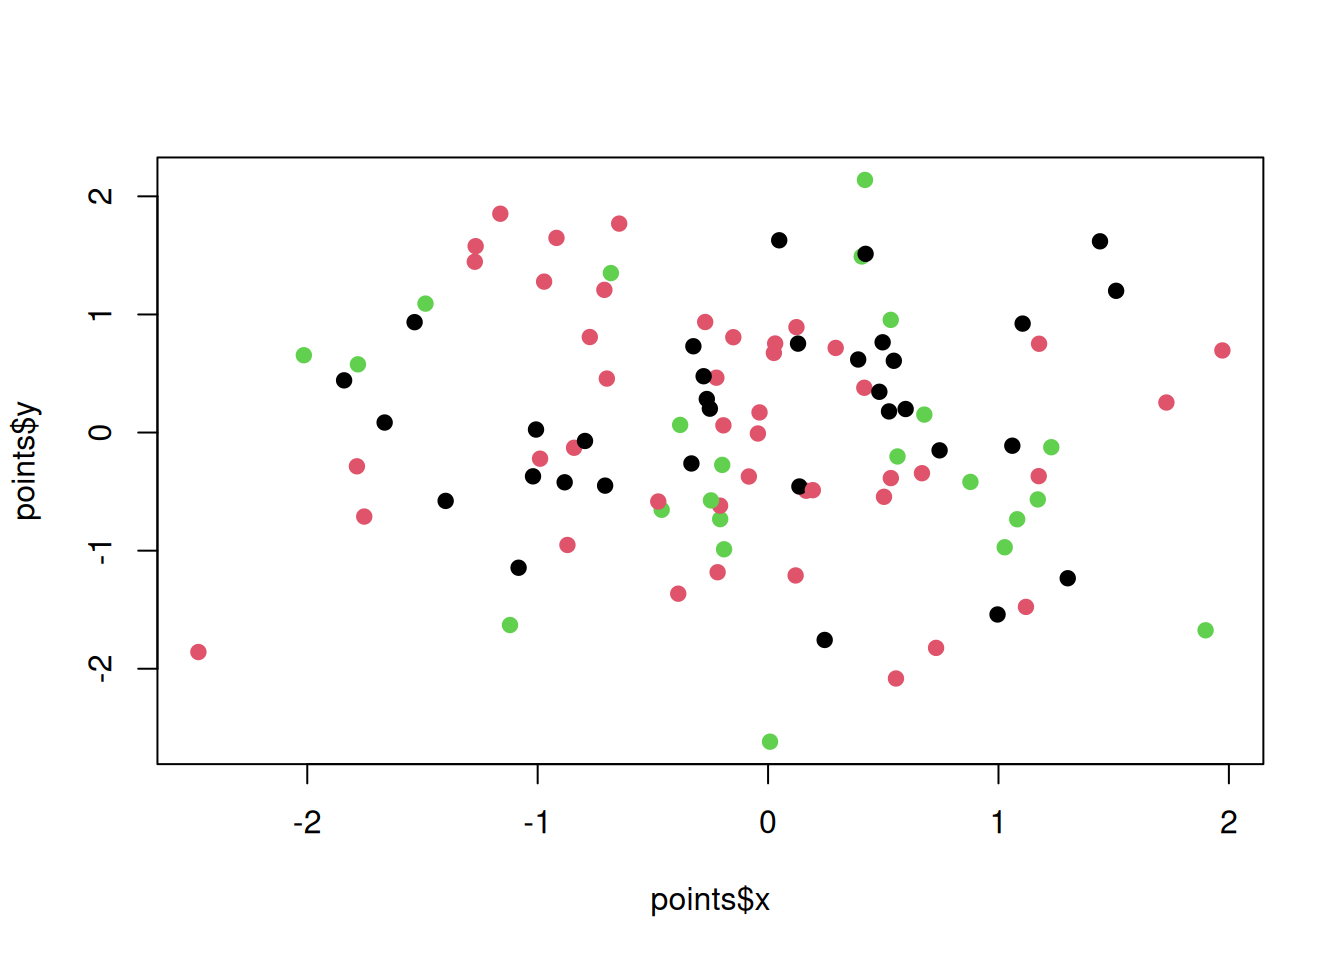
In the lectures we already saw two other plotting functions: barplot() for bar charts and hist() for drawing histograms.
barplot(table(points$z))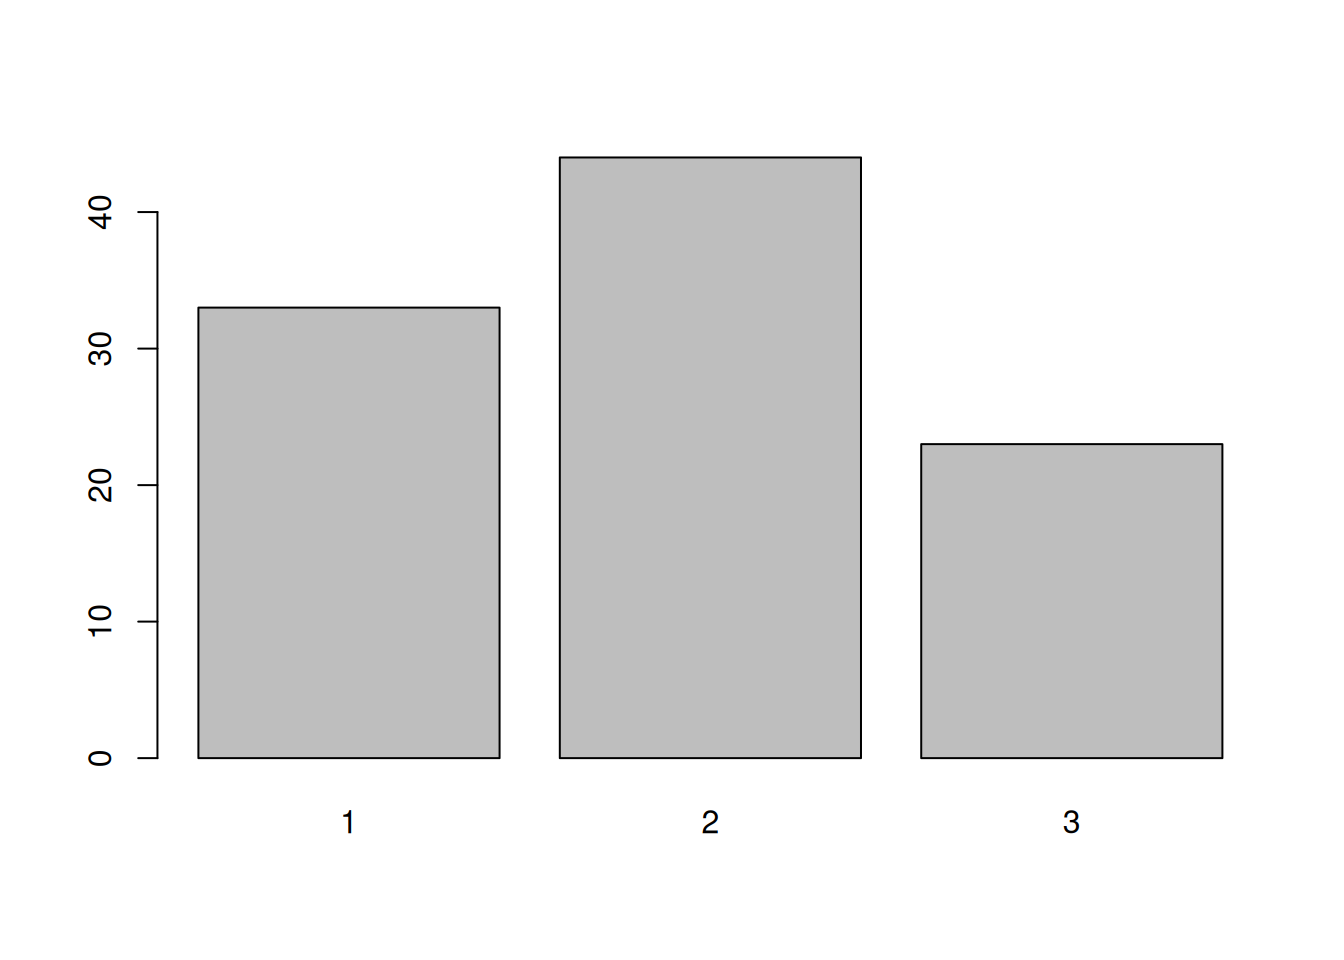
hist(points$x)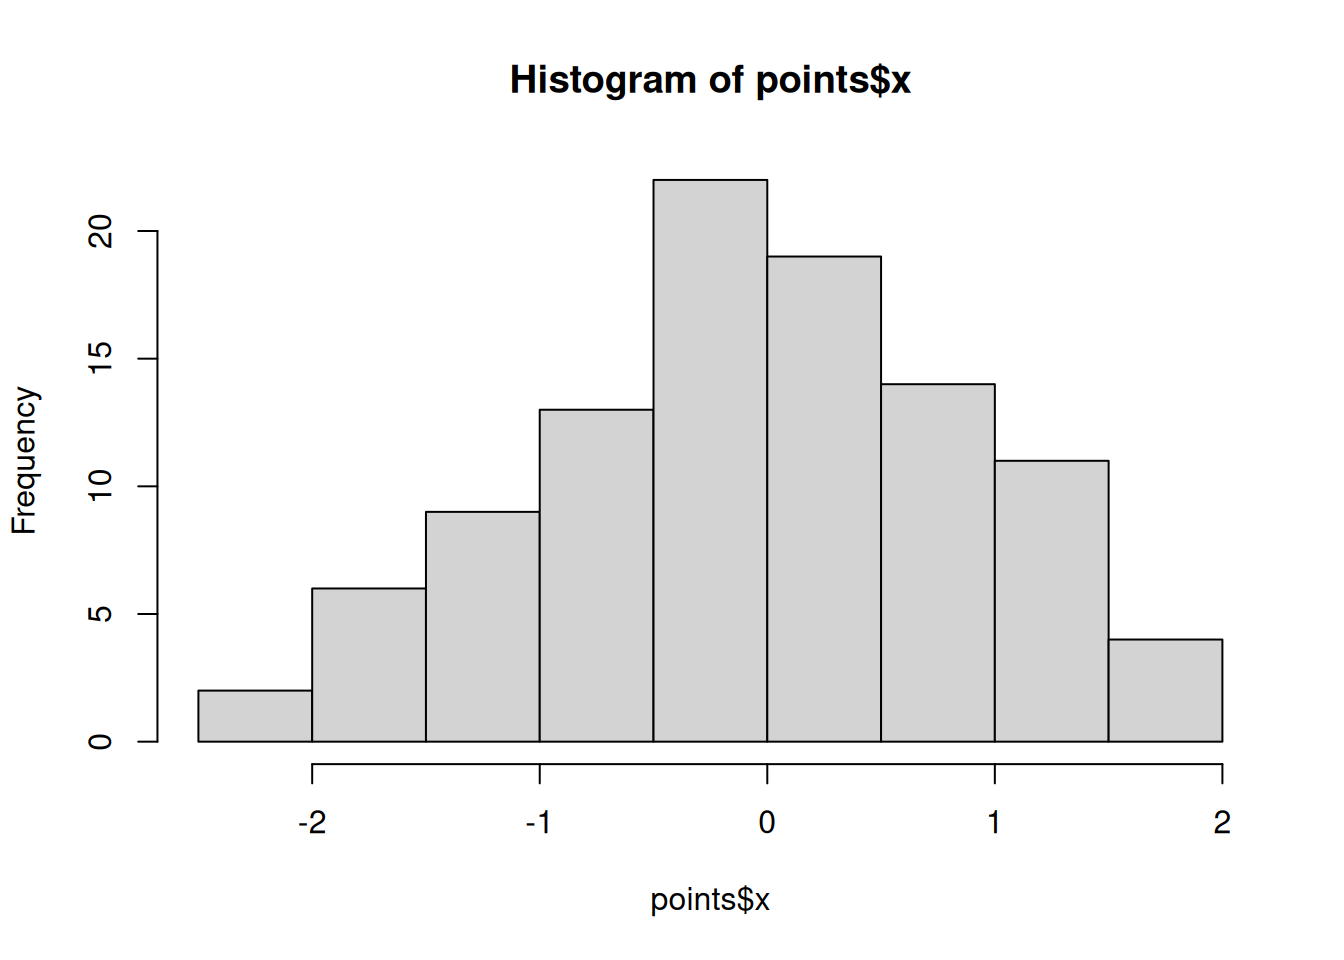
Let’s now plot using the democracy dataset. Assuming it is already loaded in, create 2 subsets of this dataset, one for countries in 2020 and one for countries in 1945. Create bar plots for each showing the proportion of democracies and autocracies (use prop.table() function to change the appearance of y-axis). Now plot histograms showing regime duration in 1945 and 2020, respectively.
Following the example from the lecture, calculate the probability of observing a given share of democracies across time if the true share is 0.5.
As reasoning in terms of ‘hypothetical population of countries’ for a given year is not very intuitive as the number is both fixed and relatively small, so it is somewhat easier to think about a hypothetical draw from a universe of polities across time.
Say, the number of unique years in the data is:
total_years <- length(unique(democracy$year))
total_years
[1] 221While the number of unique countries is:
total_countries <- length(unique(democracy$country))
total_countries
[1] 222From this we can start constructing our hypothetical universe of regimes:
regimes <- c(
  rep(1, (total_countries * total_years) / 2),
  rep(0, (total_countries * total_years) / 2)
)
regimes <- sample(regimes, length(regimes))prop.table(table(regimes))regimes
0 1
0.5 0.5